Most real estate agents have Google Analytics installed.
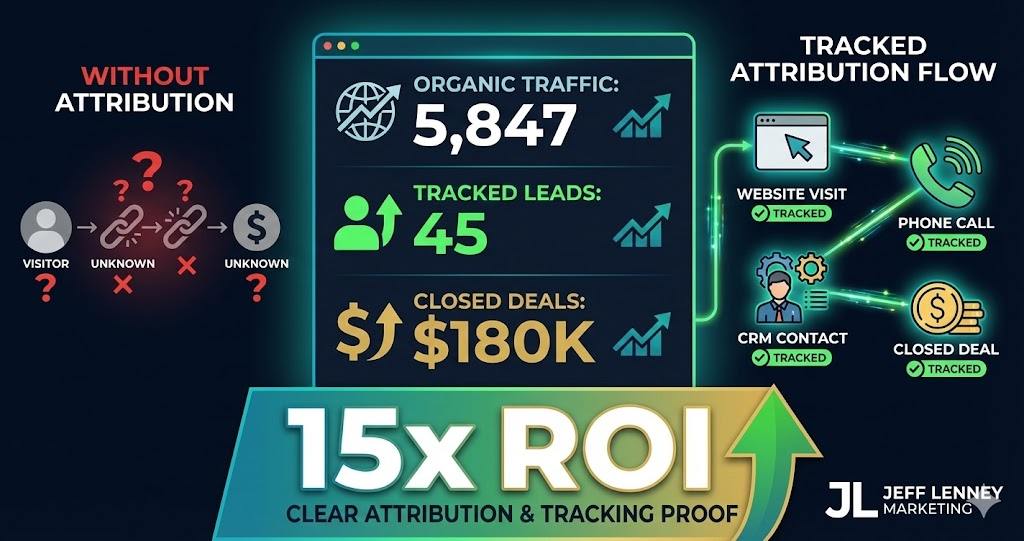
They check it once a month. See “5,847 sessions” and think “cool, traffic is up.”
Then they have no idea which of those sessions came from SEO, which turned into leads, or which leads closed.
You’re spending money on SEO (either your time or hiring help) but you can’t prove it’s working.
Your broker asks “what’s the ROI on SEO?” and you shrug and say “it takes time.”
That’s not good enough when you’re doing $20M+ in volume.
I’ve been doing SEO for 15+ years across enterprise clients. The agents who succeed with SEO aren’t necessarily the best optimizers. They’re the ones who can prove ROI with data.
Google Analytics 4 is more complex than Universal Analytics was. Attribution models are confusing. Lead sources get misreported. Your CRM doesn’t talk to your analytics.
But if you set this up correctly once, you have a dashboard that shows exactly which organic searches generate qualified leads, which content drives conversions, and what your true cost per acquisition is from SEO.
This is the complete guide to real estate analytics and attribution – GA4 setup, lead tracking, attribution models, CRM integration, and the metrics that actually matter for proving SEO ROI.
📊 Key Takeaways
- Default GA4 Setup Is Broken for Real Estate – Out-of-the-box Google Analytics misattributes leads, doesn’t track phone calls, and can’t connect web visitors to CRM contacts without custom configuration
- Lead Source Attribution Is Critical – 60-70% of real estate leads come from organic search but get misattributed as “direct” or “referral” if tracking isn’t configured properly
- Phone Calls Are Your Blind Spot – Most real estate conversions happen via phone, not web forms – without call tracking, you’re missing 80%+ of your lead data
- Multi-Touch Attribution Reveals Reality – Last-click attribution credits only the final touchpoint, but buyers typically visit your site 5-8 times across multiple channels before converting
- CRM Integration Is Non-Negotiable – Analytics that don’t connect to your CRM can’t show you which leads actually closed – traffic and conversions mean nothing without closed deals
- Monthly SEO Traffic Has 12-18 Month Sales Lag – Leads generated from SEO in January might not close until Q3 next year – judge SEO performance on lead quality, not immediate closings
Let me show you what’s broken with standard Google Analytics setup:
Phone calls aren’t tracked. Buyer sees your site, calls you directly. Google Analytics shows zero conversions because no form was submitted.
You have no idea that visitor converted.
Lead sources get misattributed. Someone finds you via organic search, bookmarks your site, returns three days later via bookmark, submits a contact form.
Google Analytics credits “direct” traffic, not organic search. Your SEO looks worthless in the data.
Long sales cycles break attribution. Visitor comes from SEO in January, returns six times over three months, finally converts in April.
Default last-click attribution credits only April’s traffic source, ignoring the six prior visits that built trust.
No CRM connection. You know someone filled out a form. You don’t know if they became a client, what they bought, or what commission you earned.
Can’t calculate true ROI without closed deal data.
Cross-device tracking fails. Same person searches on phone Monday, laptop Wednesday, tablet Friday. Google Analytics counts three separate users.
Your traffic numbers are inflated, conversion rates are deflated.
Here’s what you need: comprehensive tracking that captures phone calls, properly attributes multi-touch journeys, and connects to your CRM for closed-loop ROI measurement.
The setup takes work upfront. But once configured, you have data that actually answers “is SEO working?”
Google Analytics 4 Setup for Real Estate
GA4 is more powerful than Universal Analytics but requires proper configuration.
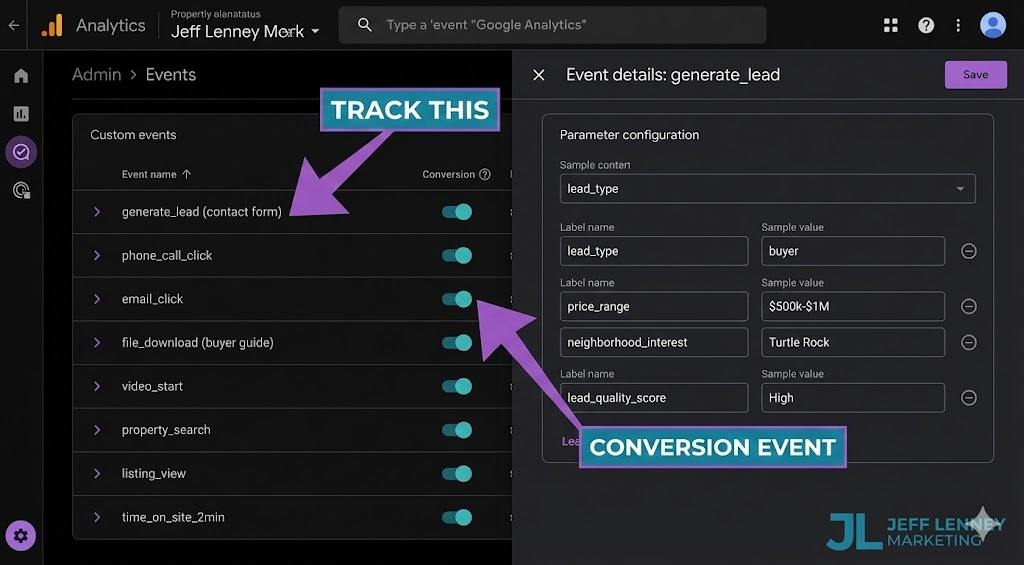
Essential GA4 Events to Configure
Out-of-the-box GA4 tracks page views. That’s not enough. You need custom events for conversions.
Contact form submissions: Track as “generate_lead” event with form type parameter (contact form, listing inquiry, market report request, etc.).
Phone number clicks: Track as “phone_call_click” event. Doesn’t capture actual calls, but shows intent.
Email link clicks: Track as “email_click” event.
PDF downloads: Track market reports, buyer guides, neighborhood guides as “file_download” events with document name parameter.
Video plays: Track property tour videos, neighborhood videos as “video_start” and “video_complete” events.
IDX search interactions: Track property searches, saved searches, listing views as custom events (requires IDX provider integration or custom code).
Listing detail page views: Track as enhanced “view_item” events with property details (price range, neighborhood, property type).
Time on site milestones: Track visitors who spend 2+ minutes, 5+ minutes as engagement events (indicates serious interest, not just bounce).
Custom Dimensions and Metrics
Standard GA4 dimensions aren’t detailed enough for real estate attribution.
Create these custom dimensions:
Lead Type: Buyer, seller, investor, renter (captured from form selections)
Price Range: Under $1M, $1M-$2M, $2M-$5M, $5M+ (from listing views or form data)
Neighborhood Interest: Which neighborhood pages they viewed
Lead Quality Score: Hot, warm, cold (based on engagement signals – time on site, pages viewed, repeat visits)
Traffic Campaign: Specific SEO content that drove visit (neighborhood guide, market report, blog post)
Device Category Detail: Not just mobile/desktop but iPhone, Android, specific models (helps optimize for your actual audience)
These dimensions let you segment reports by actual business value, not just pageviews.
For the complete technical SEO setup including proper schema markup and structured data that feeds analytics, see my comprehensive real estate SEO guide.
Lead Source Attribution Configuration
GA4’s default attribution is better than Universal Analytics but still needs tuning.
Enable Google Signals: Allows cross-device tracking when users are signed into Google. Settings → Data Collection → Google Signals.
Configure session timeout: Default is 30 minutes. For real estate, extend to 4 hours. Buyers spend time researching, comparing properties. Don’t count it as multiple sessions.
Set up UTM parameter tracking: Tag all your marketing with consistent UTM parameters. Your email newsletter, social media posts, paid ads, guest posts.
Example: jefflenney.com/blog/irvine-neighborhoods/?utm_source=newsletter&utm_medium=email&utm_campaign=monthly_update
Create channel groups: Separate “Organic Search” into subcategories: “Organic – Neighborhood Content,” “Organic – Market Reports,” “Organic – Listings.”
Lets you see which type of SEO content drives best results.
Call Tracking: The Missing 80% of Your Data
![]()
Most real estate conversions happen by phone. If you’re not tracking calls, you’re blind.
Call Tracking Solutions
- CallRail: Industry standard. Dynamic number insertion (shows different phone numbers to different traffic sources). Integrates with GA4 and most CRMs. $45-195/month depending on call volume.
- CallTrackingMetrics: More enterprise features. Form tracking included. Better for teams. $49-299/month.
- DialogTech: High-end solution with AI call analysis. Identifies caller intent, qualifies leads automatically. $300+/month.
How dynamic number insertion works:
Visitor from organic search sees (714) 555-0101 on your site. Visitor from paid ads sees (714) 555-0102. Visitor from direct traffic sees (714) 555-0103.
When they call, you know exactly where they came from. Call tracking platform sends data to Google Analytics as conversion event.
Essential call tracking features:
- Call recording: Review calls to understand lead quality. “I’m interested in selling” is different from “what’s your commission?”
- Call transcription: Searchable text transcripts. Filter for keywords like “ready to sell,” “pre-approved,” “cash buyer.”
- Keyword-level attribution: See which organic search keywords generated calls, not just that it came from “organic search.”
- Form and call matching: Track visitors who fill out form AND call. Count as single lead, not double.
- CRM integration: Automatically create CRM contact when call comes in, with source attribution data attached.
Without call tracking, your analytics show 50 form conversions. With call tracking, you see 50 forms + 180 calls = 230 total conversions.
Completely changes your ROI calculation.
Attribution Models: Understanding the Buyer Journey
Real estate has long, multi-touch sales cycles. Single-attribution models lie to you.
Attribution Model Options
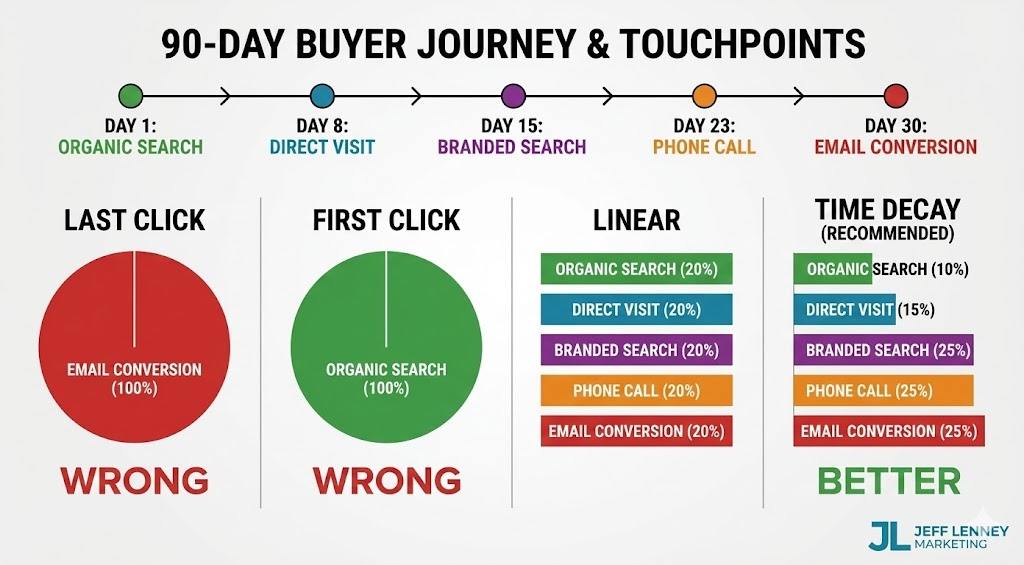
Last Click (GA4 default): Credits only the final touchpoint before conversion.
Visitor journey: Organic search → Direct → Email → Paid ad → Conversion.
Last click attributes 100% to paid ad. Ignores the organic search that started the relationship.
First Click: Credits only the initial touchpoint.
Same journey: 100% credit to organic search. Ignores the nurturing that happened via email and retargeting.
Linear: Equal credit to all touchpoints.
Same journey: Organic 25%, Direct 25%, Email 25%, Paid 25%. Fair but doesn’t weight important touchpoints.
Time Decay: More credit to touchpoints closer to conversion.
Same journey: Organic 10%, Direct 15%, Email 25%, Paid 50%. Assumes recent interactions matter more.
Data-Driven (recommended): Google’s machine learning attributes credit based on actual conversion patterns in your data.
Requires 400+ conversions monthly to generate model. Most agents don’t have volume, so use Time Decay as fallback.
Real Estate Attribution Reality
Typical high-value buyer journey (simplified):
1. Day 1: Organic search “Irvine neighborhoods” → Read neighborhood guide → Bookmark site
2. Day 8: Direct visit → Read market report → Download buyer guide PDF
3. Day 15: Organic search “[Your Name] reviews” → Read testimonials → Save contact info
4. Day 23: Direct visit → View active listings → Call your number
5. Day 30: Email click from your newsletter → Schedule showing
6. 90+ days later: Close transaction
- Last-click attribution: Credits email newsletter (90+ days after first visit).
- First-click attribution: Credits initial neighborhood guide.
- Reality: All touchpoints contributed. Neighborhood guide attracted them. Market report built authority. Testimonials built trust. Phone call converted them. Email kept them engaged.
- Use Time Decay or Data-Driven models for real estate. Configure in GA4: Admin → Attribution Settings → Attribution Models.
CRM Integration and Closed-Loop Tracking
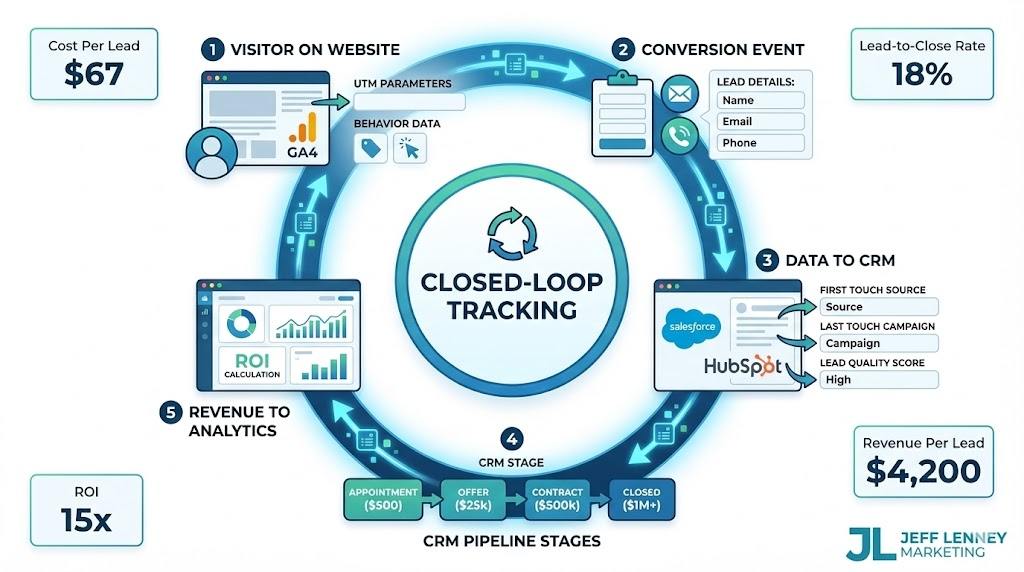
Analytics without CRM connection is worthless. You need to know which leads closed.
Integration Approaches
Native integrations: Top CRMs have Google Analytics integrations.
Salesforce, HubSpot, Follow Up Boss, LionDesk, Real Geeks all offer GA4 integration.
Configuration varies by platform. Usually requires embedding GA4 tracking code in CRM forms and configuring event passback.
Zapier automation: If your CRM lacks native integration, use Zapier to connect GA4 events to CRM.
Example: GA4 “generate_lead” event → Zapier → Create contact in CRM with UTM source data.
Manual tagging: Worst case, manually tag lead sources in CRM when leads come in. Time-consuming but better than nothing.
What to Track in CRM
- When lead enters CRM, capture these attribution fields:
- First Touch Source: Initial traffic source (organic search, paid ad, referral, direct)
- First Touch Medium: Channel detail (organic search, cpc, social, email)
- First Touch Campaign: Specific campaign/content (neighborhood-guide, market-report, listing-page)
- Last Touch Source/Medium/Campaign: Final touchpoint before conversion
- Landing Page: First page they visited on your site
- Conversion Page: Page where they converted (submitted form or called)
- Total Sessions: How many times they visited before converting
- Total Pageviews: Total engagement before converting
- Lead Quality Score: Hot/warm/cold based on engagement signals
As leads progress through pipeline, update CRM:
- Appointment Scheduled: Date and property viewed
- Offer Submitted: Date and property
- Contract Signed: Date and terms
- Closed: Date, final sale price, your commission
- Close Time: Days from initial contact to closing
- This creates closed-loop reporting. You can calculate:
- Cost Per Lead (CPL): SEO investment divided by leads generated
- Lead-to-Appointment Rate: Percentage of leads that schedule showings
- Lead-to-Close Rate: Percentage of leads that close
- Revenue Per Lead: Total commission divided by leads generated
- Customer Acquisition Cost (CAC): Total marketing spend divided by closed deals
- Return on Investment (ROI): Total commission divided by total SEO investment
Without CRM integration, you know traffic and conversions. With integration, you know business impact.
Google Search Console: The SEO-Specific Analytics
Google Analytics shows traffic after they arrive. Search Console shows what happened before they clicked.
Critical Search Console Metrics
Impressions: How many times your pages appeared in search results. If impressions are growing but clicks aren’t, you have a title/meta description problem.
Average Position: Where you rank. Position 1-3 get 50%+ of clicks. Position 11-20 get almost nothing. Track position changes over time for target keywords.
Click-Through Rate (CTR): Percentage of impressions that generated clicks. Average CTR by position:
– Position 1: 28-35%
– Position 2: 15-18%
– Position 3: 10-12%
– Position 4-10: 2-8%
If your CTR is below these benchmarks for your average position, improve your title tags and meta descriptions.
Query-level data: See exact searches that triggered your pages. Discover new keyword opportunities you didn’t target.
Example: You’re ranking #8 for “Turtle Rock Irvine schools” with 150 monthly impressions but only 5 clicks. Create dedicated content optimizing for this keyword.
Search Console Reports to Monitor
Performance Report (Queries): Which keywords drive traffic. Filter by:
– High impressions, low clicks (title/meta optimization opportunity)
– High clicks, low conversions (content/CTA improvement needed)
– Position 5-15 (quick win opportunities – push from page 1 middle to top 3)
Performance Report (Pages): Which pages get search traffic. Identify:
– Top performers to double down on
– Pages with declining traffic to refresh
– Pages ranking but not converting to prioritize for CTA optimization
Index Coverage Report: Shows crawl errors, indexing issues. If important pages aren’t indexed, they can’t rank.
Core Web Vitals Report: Page speed metrics. Poor scores hurt rankings. See my real estate website speed optimization guide for fixes.
Links Report: Shows who’s linking to you. Monitor for:
– New backlinks (track link building progress)
– Lost backlinks (reach out to reclaim)
– Your most linked pages (create more similar content)
Connect Search Console to GA4: Admin → Property Settings → Search Console Links. Enables Search Console data in GA4 reports.
Metrics That Actually Matter vs Vanity Metrics
Most agents track the wrong numbers.
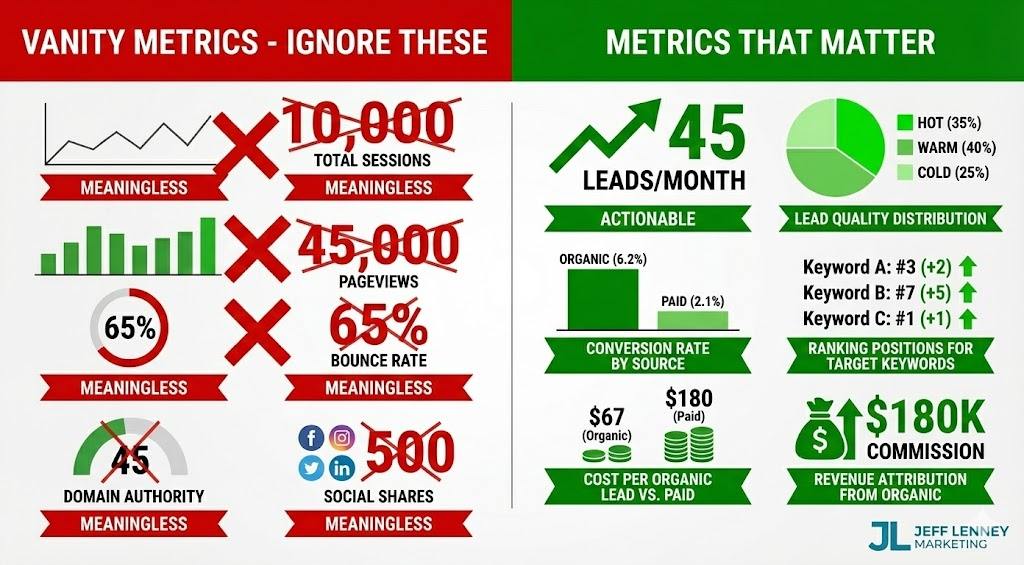
Vanity Metrics (Don’t Obsess Over These)
Total Sessions: Meaningless without conversion context. 10,000 sessions with zero leads is worse than 100 sessions with 10 qualified leads.
Pageviews: Same issue. High pageviews from bot traffic or irrelevant searches don’t generate business.
Bounce Rate: GA4 measures “engagement rate” now. High bounce isn’t necessarily bad if visitor found what they needed and called you.
Domain Authority: Moz/Ahrefs metric that doesn’t directly correlate with rankings or revenue. Focus on ranking for keywords that matter, not DA scores.
Social Shares: Nice for ego, irrelevant for lead generation. Viral post with 500 shares generates fewer leads than ranking #1 for “sell my Irvine home.”
Metrics That Drive Business Decisions
Organic Lead Volume: Total leads from organic search. Track month-over-month growth.
Lead Quality Distribution: Percentage hot vs warm vs cold. SEO should generate higher percentage of qualified leads than paid ads.
Organic Traffic to Target Pages: Traffic to your money pages (neighborhood guides, market reports, seller pages) matters more than blog traffic.
Ranking Position for Target Keywords: Track 20-30 high-value keywords. Position improvements predict lead volume increases 2-3 months later.
Conversion Rate by Traffic Source: Organic should convert 3-8%. If it’s under 2%, you’re ranking for wrong keywords or content doesn’t match intent.
Cost Per Organic Lead: Monthly SEO investment divided by organic leads. Compare to cost per lead from paid ads.
Lead-to-Close Rate by Source: Do organic leads close at higher rates than paid leads? Usually yes, because they found you through research, not interruption.
Revenue Per Organic Lead: Total commission from organic-sourced deals divided by total organic leads. This is your true SEO ROI metric.
Organic Revenue Growth: Quarter-over-quarter organic-sourced revenue. This is what matters to your bottom line.
Track these in a monthly dashboard. Ignore vanity metrics.
Building Your SEO Performance Dashboard
Checking multiple platforms is inefficient. Build one dashboard with key metrics.
Dashboard Tools
Google Looker Studio (free): Connects GA4, Search Console, Google Ads. Build custom dashboards. Steep learning curve but powerful.
Klipfolio ($49-799/month): Easier than Looker Studio. Pre-built templates. Connects more data sources including CRMs.
DashThis ($39-249/month): Simple drag-and-drop. Good for non-technical users. Client-friendly reports.
Cyfe ($29-99/month): All-in-one business dashboard. Includes SEO but also social, email, CRM metrics.
Essential Dashboard Widgets
- Organic Traffic Trend: Month-over-month line chart. Should trend upward over 12+ months.
- Organic Lead Volume: Monthly bar chart. Include lead quality breakdown (hot/warm/cold).
- Top Converting Keywords: Table showing keywords that drive leads, not just traffic.
- Top Converting Pages: Which content generates most leads. Double down on similar content.
- Ranking Position Changes: Track 20-30 target keywords. Highlight position improvements in green, declines in red.
- Organic Revenue (if CRM connected): Total commission from organic-sourced deals. This is the number that matters.
- Cost Per Lead Comparison: Organic vs paid vs referral. Shows ROI relative to other channels.
- Lead Pipeline by Source: Current leads in pipeline, segmented by source. Shows future revenue potential.
- New vs Returning Visitors: Returning visitor growth indicates brand strength. SEO builds brand over time.
- Device Category Performance: Mobile vs desktop traffic and conversions. Optimize for your actual audience.
Update dashboard monthly. Review with your team or broker to show SEO progress.
Proving SEO ROI: The Real Conversation
Your broker or business partner asks: “What’s the ROI on SEO?”
Here’s how to answer with data:
- Show lead volume growth: “We generated 45 organic leads in Q1, up from 28 in Q4. That’s 60% growth quarter-over-quarter.”
- Show lead quality: “35% of our organic leads are hot qualified buyers or motivated sellers, compared to 18% from paid ads.”
- Show cost efficiency: “Our cost per organic lead is $67. Cost per paid lead is $180. We’re getting 3x more leads per dollar from SEO.”
- Show revenue attribution: “We closed 8 deals from organic-sourced leads in Q1, generating $180K in commission. Our quarterly SEO investment was $12K. That’s 15x ROI.”
- Show pipeline value: “We currently have 22 organic leads in active pipeline representing $3.2M in potential listings. Expected commission: $96K.”
- Show long-term trajectory: “Organic traffic has grown 140% year-over-year. Lead volume has grown 95%. We expect this to continue compounding as domain authority builds.”
Compare to paid acquisition: “If we generated the same 45 leads through paid ads at $180 CPL, we’d spend $8,100 monthly or $97K annually. Our SEO investment is $4K monthly or $48K annually for better-quality leads.”
This is the conversation that gets SEO budget approved and keeps it funded long-term.
Without analytics and attribution, you’re guessing. With proper tracking, you’re proving business impact with data.
If you’re doing $20M+ in volume and want comprehensive SEO with proper analytics setup, lead tracking, and monthly ROI reporting, contact me.
I work with a small number of high-producing agents on complete real estate SEO strategies.
See my comprehensive real estate SEO guide for the complete framework, or contact me to discuss implementing it with full analytics and attribution tracking for your business.
Start tracking what matters this week:
1. Set up GA4 custom events for contact forms and phone clicks
2. Implement call tracking with CallRail or equivalent
3. Connect Search Console to GA4
4. Create custom dimensions for lead type and price range
5. Tag all marketing with UTM parameters consistently
6. Configure CRM to capture first and last touch attribution
7. Build basic dashboard with organic traffic, leads, and revenue
Everything else builds on these foundations. But without proper tracking, you’re flying blind on SEO performance.
Stop guessing whether SEO works. Start measuring what actually drives your business.
About the Author: Jeff Lenney has 15+ years of enterprise SEO and analytics experience across competitive markets. He specializes in high-ticket consulting for luxury real estate agents doing $20M+ in volume, offering comprehensive SEO packages with complete analytics setup, attribution tracking, and monthly ROI reporting. Based in Anaheim Hills, CA. Contact Jeff to discuss your real estate SEO and analytics strategy.
Frequently Asked Questions
How long does it take to see SEO results in analytics?
You’ll see ranking improvements in 2-4 months, traffic increases in 3-6 months, and lead volume growth in 4-8 months.
However, revenue impact lags significantly because real estate has long sales cycles. Leads generated from SEO in January might not close until Q3 or Q4.
Judge SEO performance on leading indicators (rankings, traffic, lead volume) in months 1-6, and revenue in months 6-18.
What’s a good organic conversion rate for real estate websites?
3-8% is typical for well-optimized real estate sites with good targeting.
Under 2% indicates wrong keyword targeting or poor content-to-intent matching. Over 10% is exceptional and usually indicates very specific local targeting.
However, conversion rate alone is misleading. 5% conversion of 1,000 monthly visitors (50 leads) is better than 10% conversion of 200 visitors (20 leads).
Focus on total qualified lead volume, not just conversion rate.
Do I really need call tracking or can I just use Google Analytics?
You absolutely need call tracking for real estate.
80%+ of real estate conversions happen via phone calls, not web forms. Without call tracking, you’re only seeing 20% of your conversions.
This makes your organic conversion rate look terrible (maybe 1-2% when it’s actually 8-10% including calls), completely distorts your ROI calculations, and prevents you from knowing which keywords and content drive calls.
Call tracking costs $50-200/month. If it helps you close one additional deal per year, it’s paid for itself 100x over.
How do I prove SEO ROI to my broker or business partner?
Connect your analytics to your CRM so you can track closed deals back to organic search sources.
Then present: (1) Total organic leads generated, (2) Lead quality distribution (hot/warm/cold), (3) Cost per organic lead vs other channels, (4) Closed deals from organic sources with total commission, (5) ROI calculation (revenue divided by SEO investment).
Example: “45 organic leads last quarter, 8 closed deals, $180K commission, $12K SEO investment = 15x ROI.”
This data-driven conversation gets SEO budget approved.
What attribution model should I use for real estate?
Use Time Decay or Data-Driven attribution models.
Last-click attribution significantly under-credits SEO because real estate buyers typically visit your site 5-8 times before converting, and the final visit is often direct traffic (bookmark) or branded search.
Time Decay gives more credit to touchpoints closer to conversion but still values the initial organic search that started the relationship.
Data-Driven is ideal but requires 400+ monthly conversions, which most individual agents don’t have.
How do I track which neighborhood content drives leads?
Set up GA4 custom dimensions for “Neighborhood Interest” and “Landing Page.”
When someone converts, capture which neighborhood pages they viewed during their session and which page they landed on initially.
Also use UTM parameters in internal links: When linking to your neighborhood guide from blog posts, add ?utm_campaign=turtle-rock-guide so you can track conversions specifically from that content.
In Search Console, filter Performance report by page to see which neighborhood pages get impressions and clicks.
Should I track individual listing page performance?
Only if you control the listing pages (not just IDX).
IDX listing pages typically have minimal SEO value because they’re duplicate content across thousands of agent sites and the listings change constantly.
If you create unique listing pages on your domain with custom descriptions, neighborhood context, and market analysis, then yes – track them as “view_item” events with property details (price range, neighborhood, beds/baths).
But for most agents, focus analytics on your owned content (neighborhood guides, market reports, seller pages) rather than IDX listings.
What’s the difference between Google Analytics and Search Console?
Google Analytics tracks what happens ON your site (visits, pageviews, conversions). Search Console tracks what happens BEFORE visitors arrive (search impressions, ranking positions, click-through rates from search results).
You need both for complete SEO measurement.
Search Console shows you’re ranking #5 for “Irvine neighborhoods” with 300 monthly impressions but only 15 clicks (5% CTR). Analytics shows those 15 visitors spent 3 minutes on site and 2 converted to leads.
Search Console diagnoses ranking/visibility issues. Analytics diagnoses conversion issues.
How often should I check my analytics?
Weekly for monitoring trends, monthly for formal reporting and decisions.
Daily checking creates anxiety over normal fluctuations. Weekly gives you enough data to spot issues (traffic drop, conversion rate decline, ranking losses) without overreacting to noise.
Monthly reporting should include: organic traffic trend, lead volume by source, ranking position changes for target keywords, conversion rate by landing page, revenue attribution (if CRM connected).
Quarterly reviews should assess strategy: which content performs best, which keywords to prioritize, where to invest more effort.
Can I do analytics setup myself or should I hire help?
Basic GA4 setup you can DIY following Google’s documentation. Adding UTM parameters to links is straightforward.
However, custom event tracking, CRM integration, call tracking implementation, and building dashboards with proper attribution models typically require technical expertise.
If you’re doing $20M+ in volume, your time is worth more than the $2K-5K it costs to have someone set this up correctly once.
Bad analytics is worse than no analytics because it leads to wrong decisions based on bad data.
Sources
This guide references analytics and attribution best practices from:
- Google Analytics – GA4 documentation and implementation guides: https://support.google.com/analytics
- Google Search Console – Search performance and indexing documentation: https://support.google.com/webmasters
- CallRail – Call tracking and attribution methodology: https://www.callrail.com/blog/
- 15+ years of enterprise SEO and analytics implementation experience across competitive real estate markets
{
“@context”: “https://schema.org”,
“@type”: “Article”,
“headline”: “Real Estate Analytics & Attribution: Tracking SEO ROI That Actually Matters”,
“description”: “Master real estate analytics with GA4 setup, call tracking, attribution models, CRM integration, and metrics that prove SEO ROI for high-producing agents.”,
“image”: “https://jefflenney.com/wp-content/uploads/2025/12/real-estate-analytics-attribution-guide.jpg”,
“author”: {
“@type”: “Person”,
“name”: “Jeff Lenney”,
“url”: “https://jefflenney.com/about-me/”
},
“publisher”: {
“@type”: “Organization”,
“name”: “Jeff Lenney”,
“logo”: {
“@type”: “ImageObject”,
“url”: “https://jefflenney.com/wp-content/uploads/2025/12/jeff-lenney-logo.png”
}
},
“datePublished”: “2025-12-10”,
“dateModified”: “2025-12-10”,
“mainEntityOfPage”: {
“@type”: “WebPage”,
“@id”: “https://jefflenney.com/blog/real-estate-analytics-attribution/”
}
}
